
|
|
|
|
|
|
| Project Name: | Sample Report - Twin Bowl Sink - Half Model (for clarity) |
|---|---|
| Requested By: | Potential Clients of FlowTech Design Limited |
| Prepared By: | Clive Fenn, FlowTech Design Limited, 355 Green Lane, Great Lever, Bolton, BL3 2LU, United Kingdom |
| Reviewed By: | Telephone and Facsimile: 44 (0) 1204 362 622; Mobile 07949 200 926 |
| Date: | 18th December 2001 |
This is a sample report based on a real report.
A typical FlowTech Design analysis project and report would include the following elements: a) A preliminary report and demonstration of results, if required, at FlowTech's offices, prior to submission of the final report. b) The final email report will include a section outlining the background and objective of the analysis, c) a results section detailing findings and recommendations, d) drawings indicating gate and venting positions, weld lines, gas traps, etc. e) target processing conditions, and f) plots, animations, figures and computer generated output as deemed necessary.
The background section would indicate the objectives of the analysis and a brief background leading to the request for analysis. The report would contain details relating to the modelling necessary to produce a model suitable for analysis; a description of the material used in analysis; and details of processing conditions used. In the body of the report there would be a number of graphical and tabular outputs, with plots covering filling isochrones, gas or air traps, weld and meld line position, injection pressure plots, clamp force requirement, melt temperature plots, shear stress and shear rate plots, cooling times, frozen layer and more as deemed necessary plotted at various times during the filling and post filling stages.
A cooling analysis report would show cooling circuits and associated data relating to Reynolds Number, temperature rise, temperature difference, cooling efficiency, cooling pressure drop, cycle times and other data as is necessary.
A shrinkage and warpage analysis report would show indicated warpage and shrinkage under various conditions in an attempt to eliminate problems that might be experienced in moulding. Analysis can be undertaken on either an ideal cooling basis or based on actual cooling circuit geometry.
Graphical display of results can be from different perspectives at any practical degree of magnification. Solid fill and contour plots can be plotted together with animation of fill and occasionally other parameters. Full screen views and enlarged view of any detail in any orientation is possible. A typical mould filling flow analysis report would normally include equivalent plots to the following;
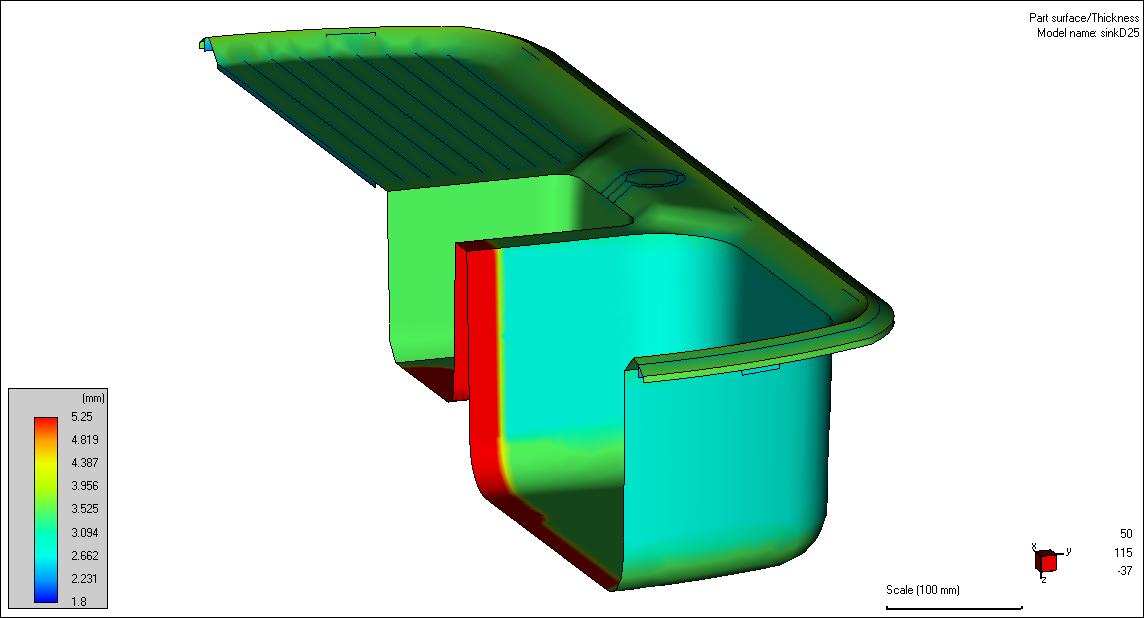
Part surface/Thickness Plots showing the position and thickness of any flow leaders or flow deflectors that were recommended to give balanced or improved filling.
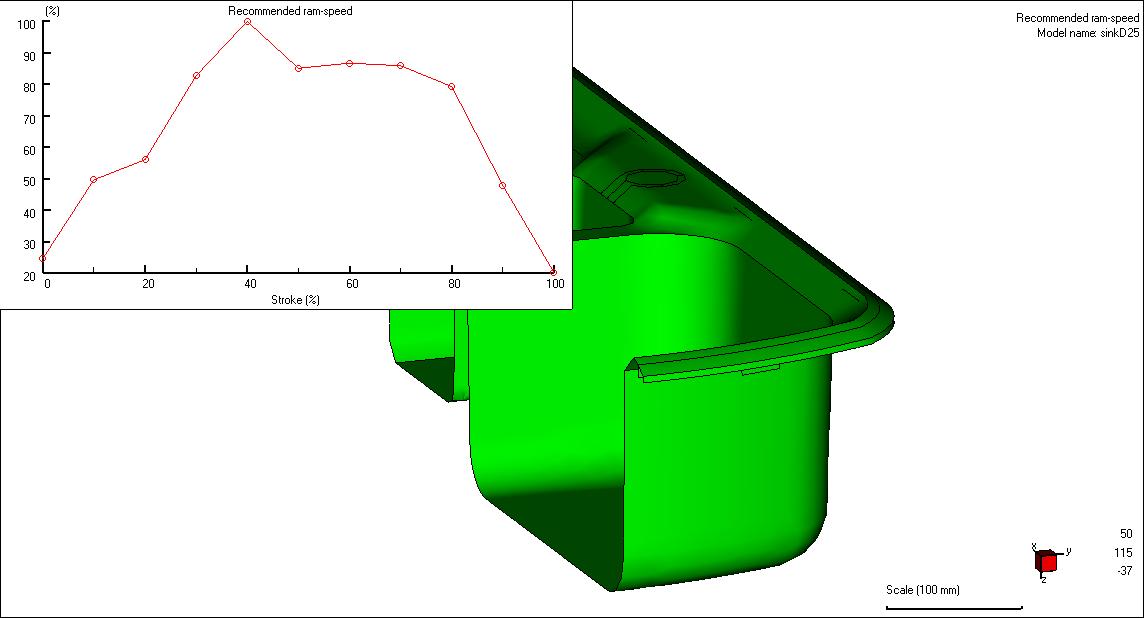
Recommended ram-speed A profiled injection was used in analysis with changeover at 98 %. Packing pressure was set at 80 % of peak pressure and held for around 6 seconds. The plot shows the recommended ram profile that should be used in production.
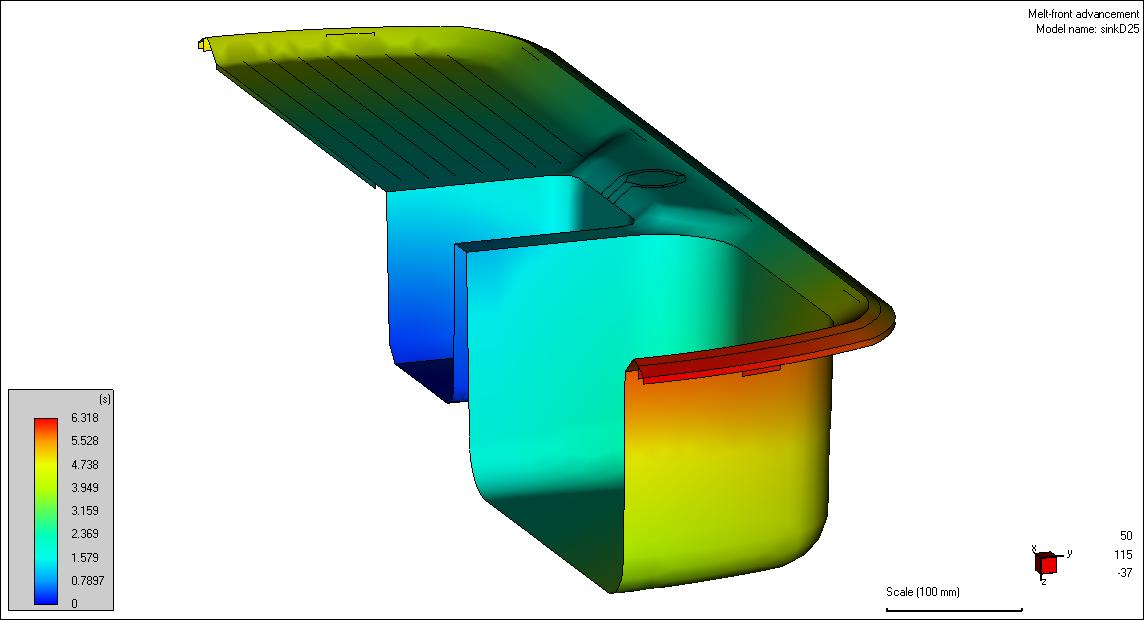
Melt-front advancement The contour plot shows flow radiating from the gate or gates sites to the ends of fill. Any problems associated with weld lines, gas traps or hesitation would be detailed as necessary.
A melt-front advancement animation would normally be included but due to the size of files and download times this option is not shown in this sample report.
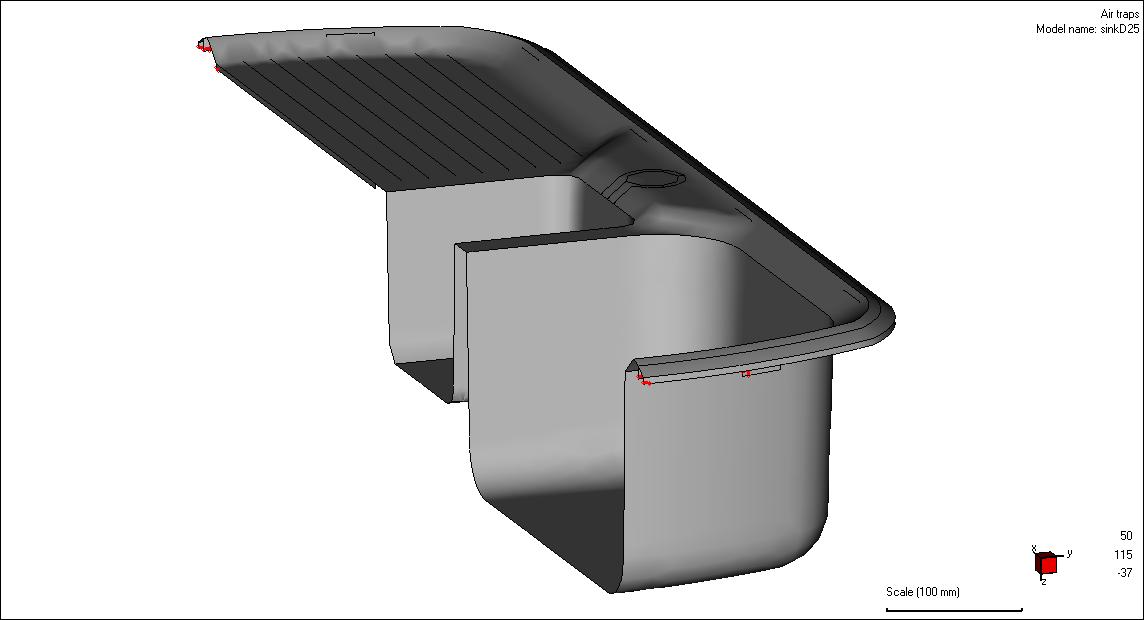
Air Traps and Weld Lines Figures would show the location of air traps and weld lines. Air traps are generally found at the end of flows in pockets or at the end of fills. While weld and meld lines occur where two melt fronts meet. Generally only weld lines are displayed. Air trap and weld line sites are usually vented and a note on venting is normally included in the text.
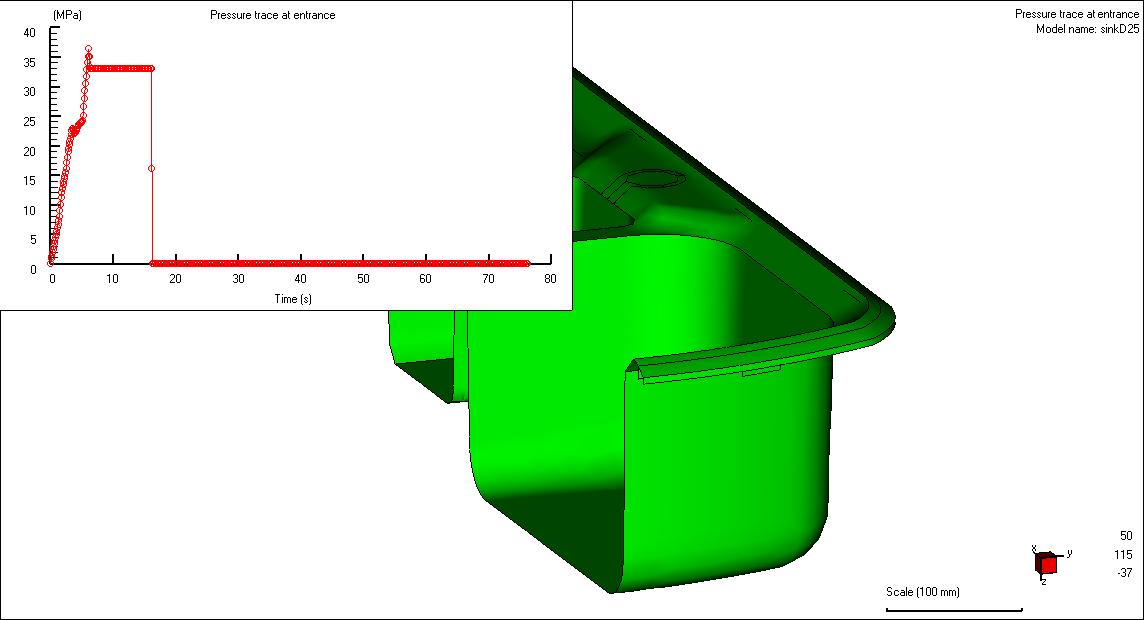
Pressure trace at entrance Pressure traces experienced at any node on the model can be plotted; however, it is normal to plot the pressure trace experienced at the tip of the sprue.
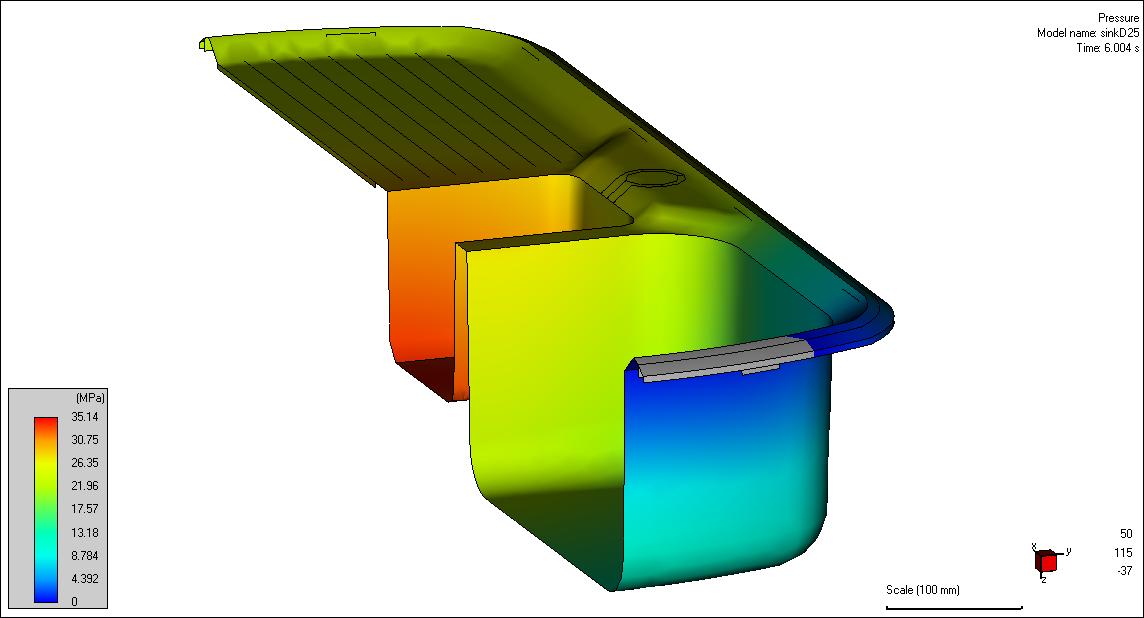
Pressure at approximately 98 % fill Pressure plots at typically 98% fill emphasise the end-of-fill sites. From these plots an indication of balanced fill can be obtained. The pressure experienced at this time is often the maximum pressure attained during fill and provided this pressure is within machine limits is usually acceptable.

Clamp force Clamp force plots indicate predicted clamp requirement throughout the cycle for the model used in analysis. After scaling as may be necessary with some models, clamp force requirement is found to be within limits of the specified machine, this objective would have been met.
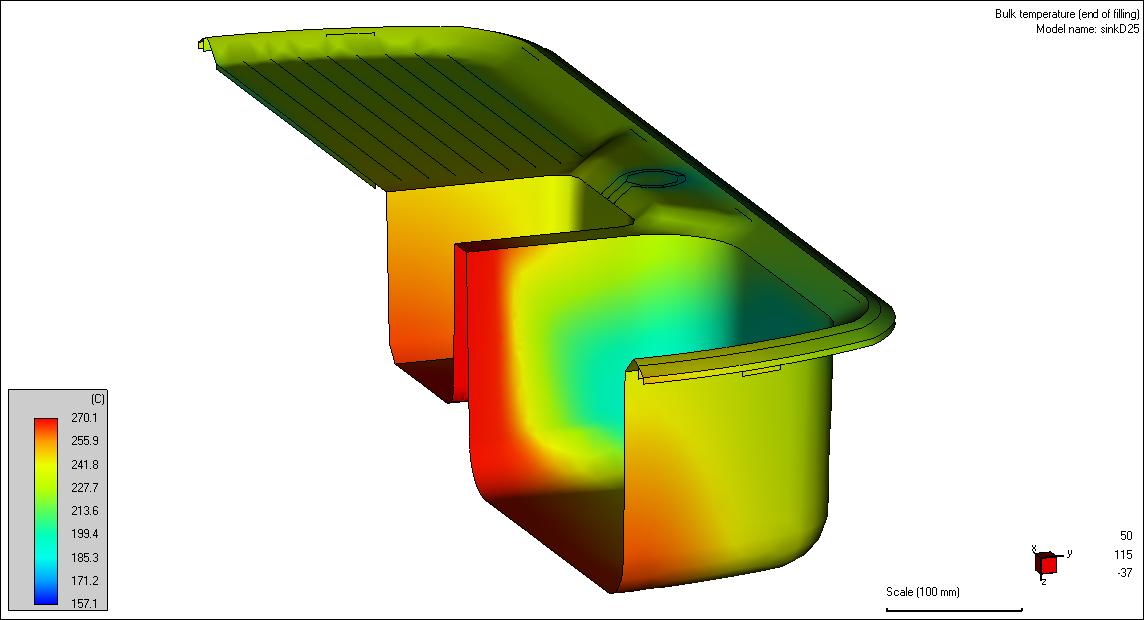
Bulk temperature (end of filling) The bulk temperature range plot indicates the quality of weld lines in the final product. Generally if temperatures at the flow front are within 20 C of the melt temperature, then good welds are likely. However, lower temperatures at end of fill might be able to be observed in thin sections or features filled early in the filling phase.
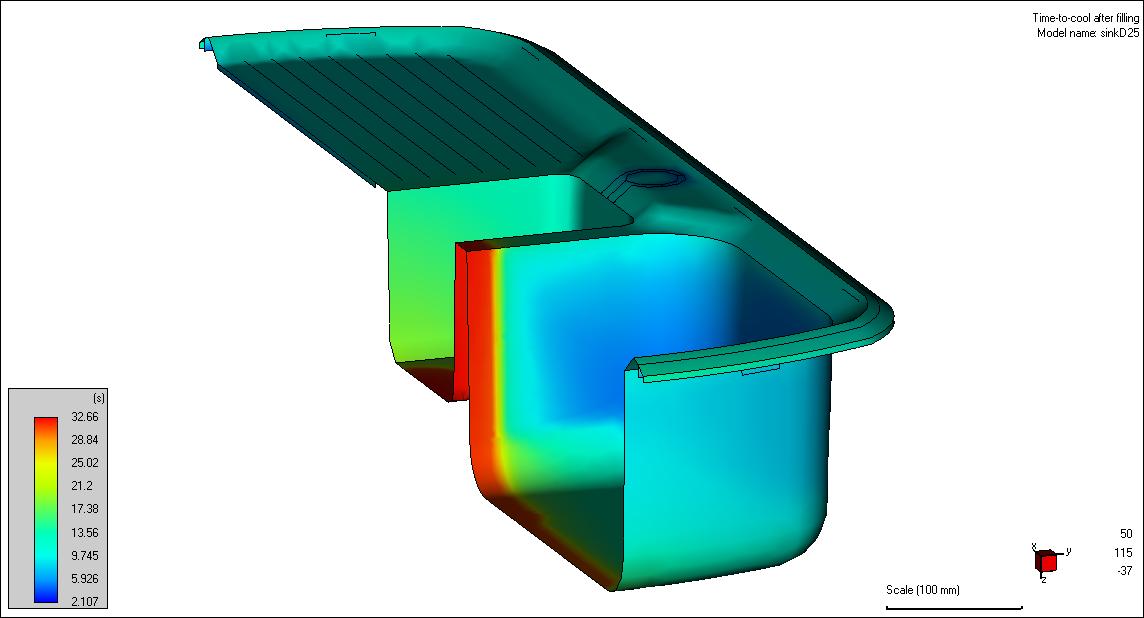
Time-to-cool after filling Time to cool of the part and any cold feed system would be displayed. A short cooling time would indicate a good site for ejection whilst the maximum cooling times would give an indication of cycle times that might be achieved.
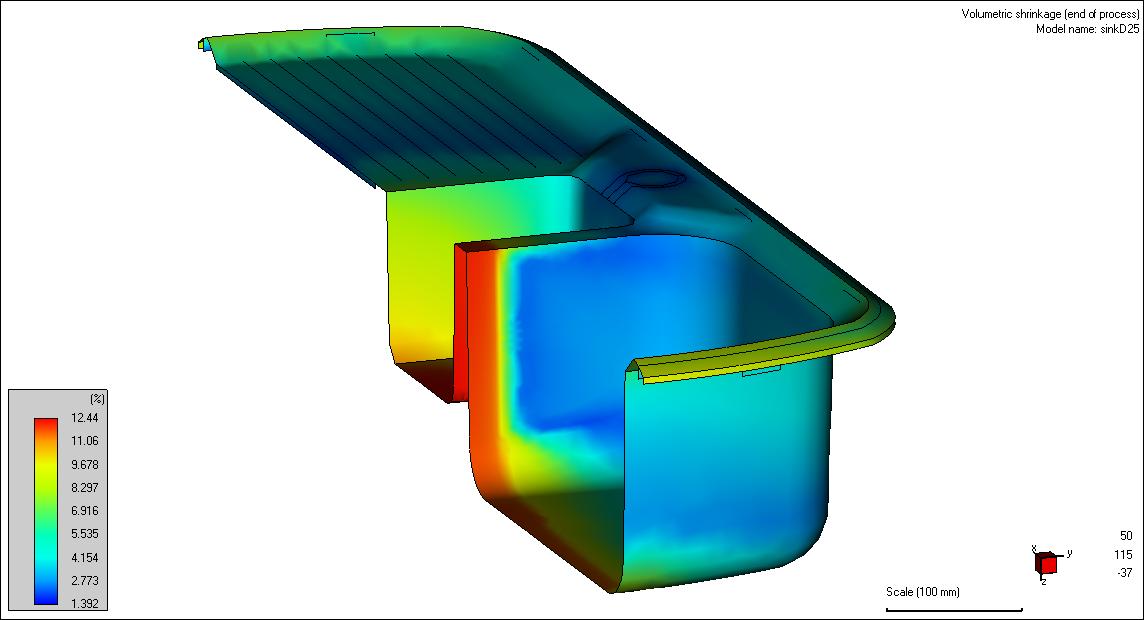
Volumetric shrinkage (end of process) Volumetric shrinkage gives an indication of shrinkage that in the part that could be expected. In general linear shrinkage is approximately one third of volumetric shrinkage.
The final section of the report would give a summary of conclusions and recommendations drawn from the main body of the report together with outline processing conditions.